
Intro
Wetlands are essential to our ecosystems and society as they provide habitat, flooding regulation, carbon storage, and water filtration. Climate change and human land use are creating pressures on wetlands, changing the hydrologic dynamics, species composition, and ultimately overall function. Identification, protection, and mitigation should be carried out to ensure that wetlands remain healthy and maintain their natural purpose.
Why Fennel Creek?
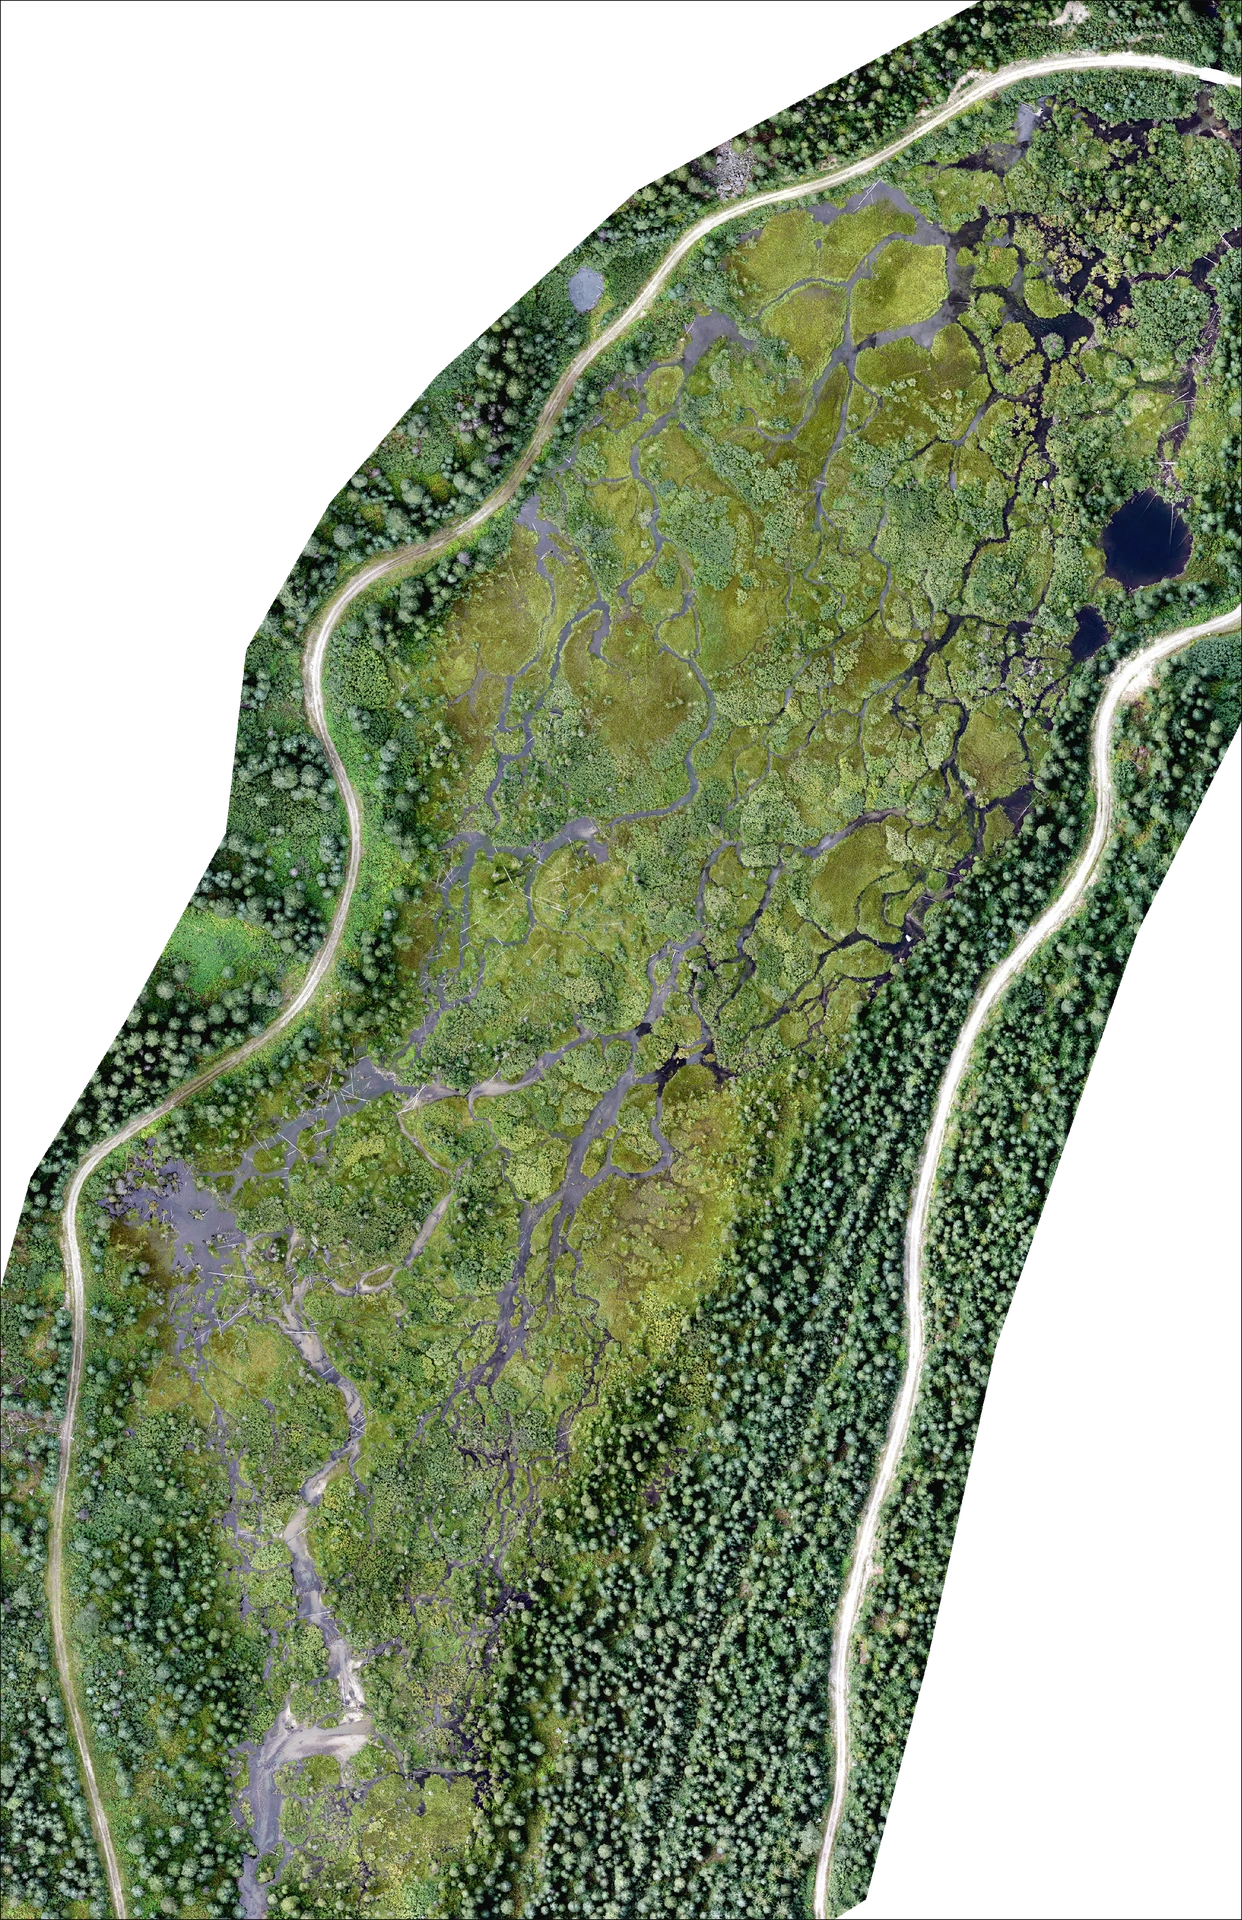
The Fennel Creek Wetland is a critical area to monitor due to changing surrounding topography caused by historical wildfires and logging activity. Knowing the state of an ecosystem is vital to conservation and climate change mitigation. Beyond that, the location provided us with a great testing ground for our drone, demonstrating its ability to map variable terrain. The map below shows historical pressures on the Fennel Creek wetland.
What data did we collect?
Using our state-of-the-art drone WingrtaOne Gen II, we planned and carried out two separate missions to acquire aerial imagery of the Fennel Creek Wetland. Collecting high-resolution RGB and multispectral imagery can be used to investigate hydrology and wetland health.
What information did we create?
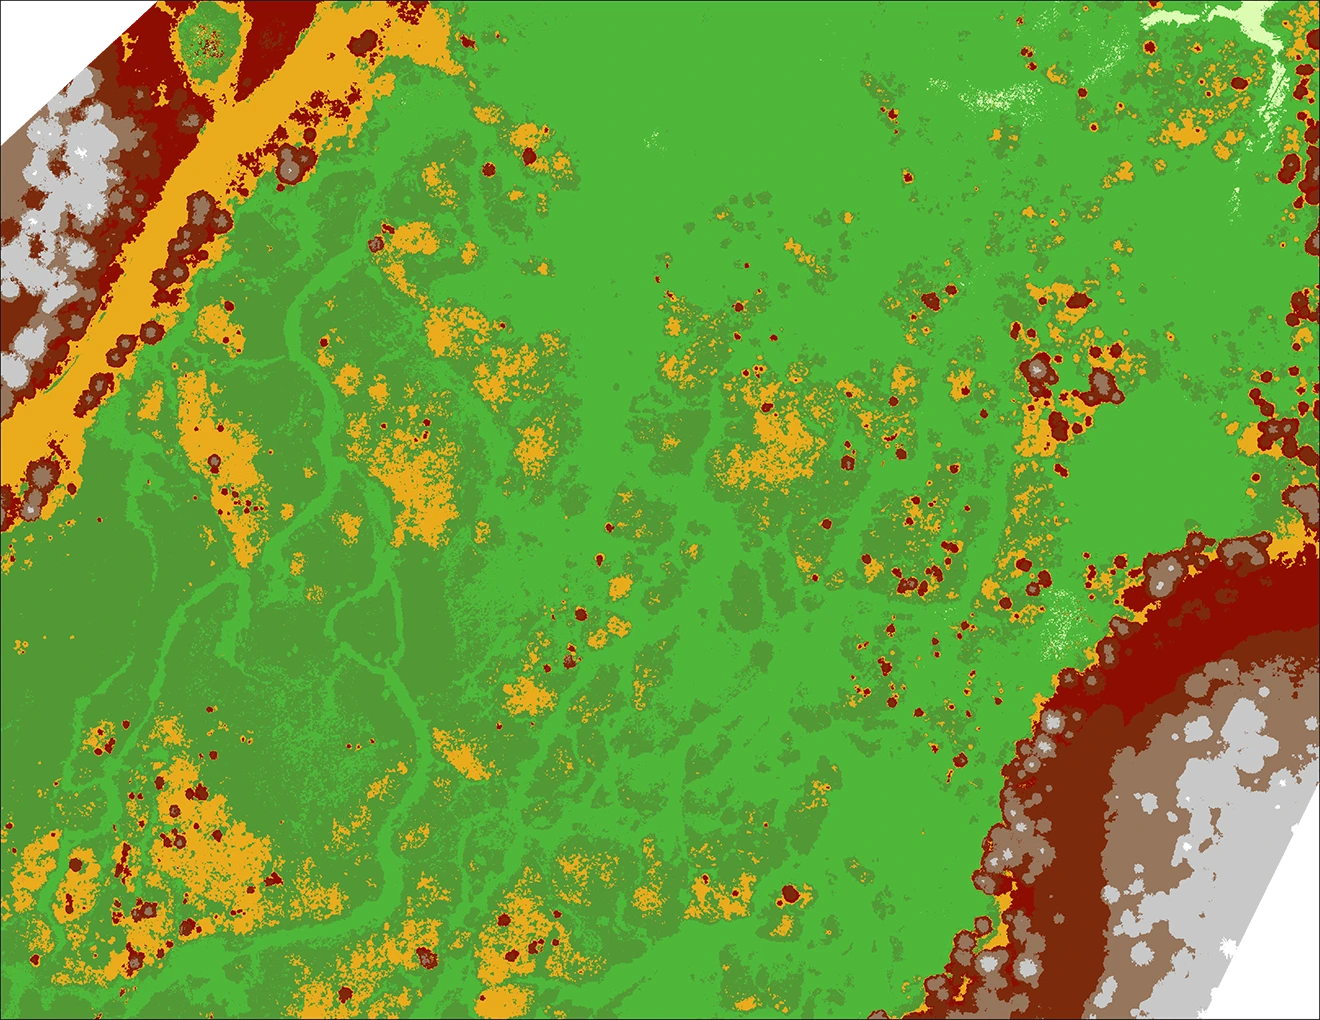
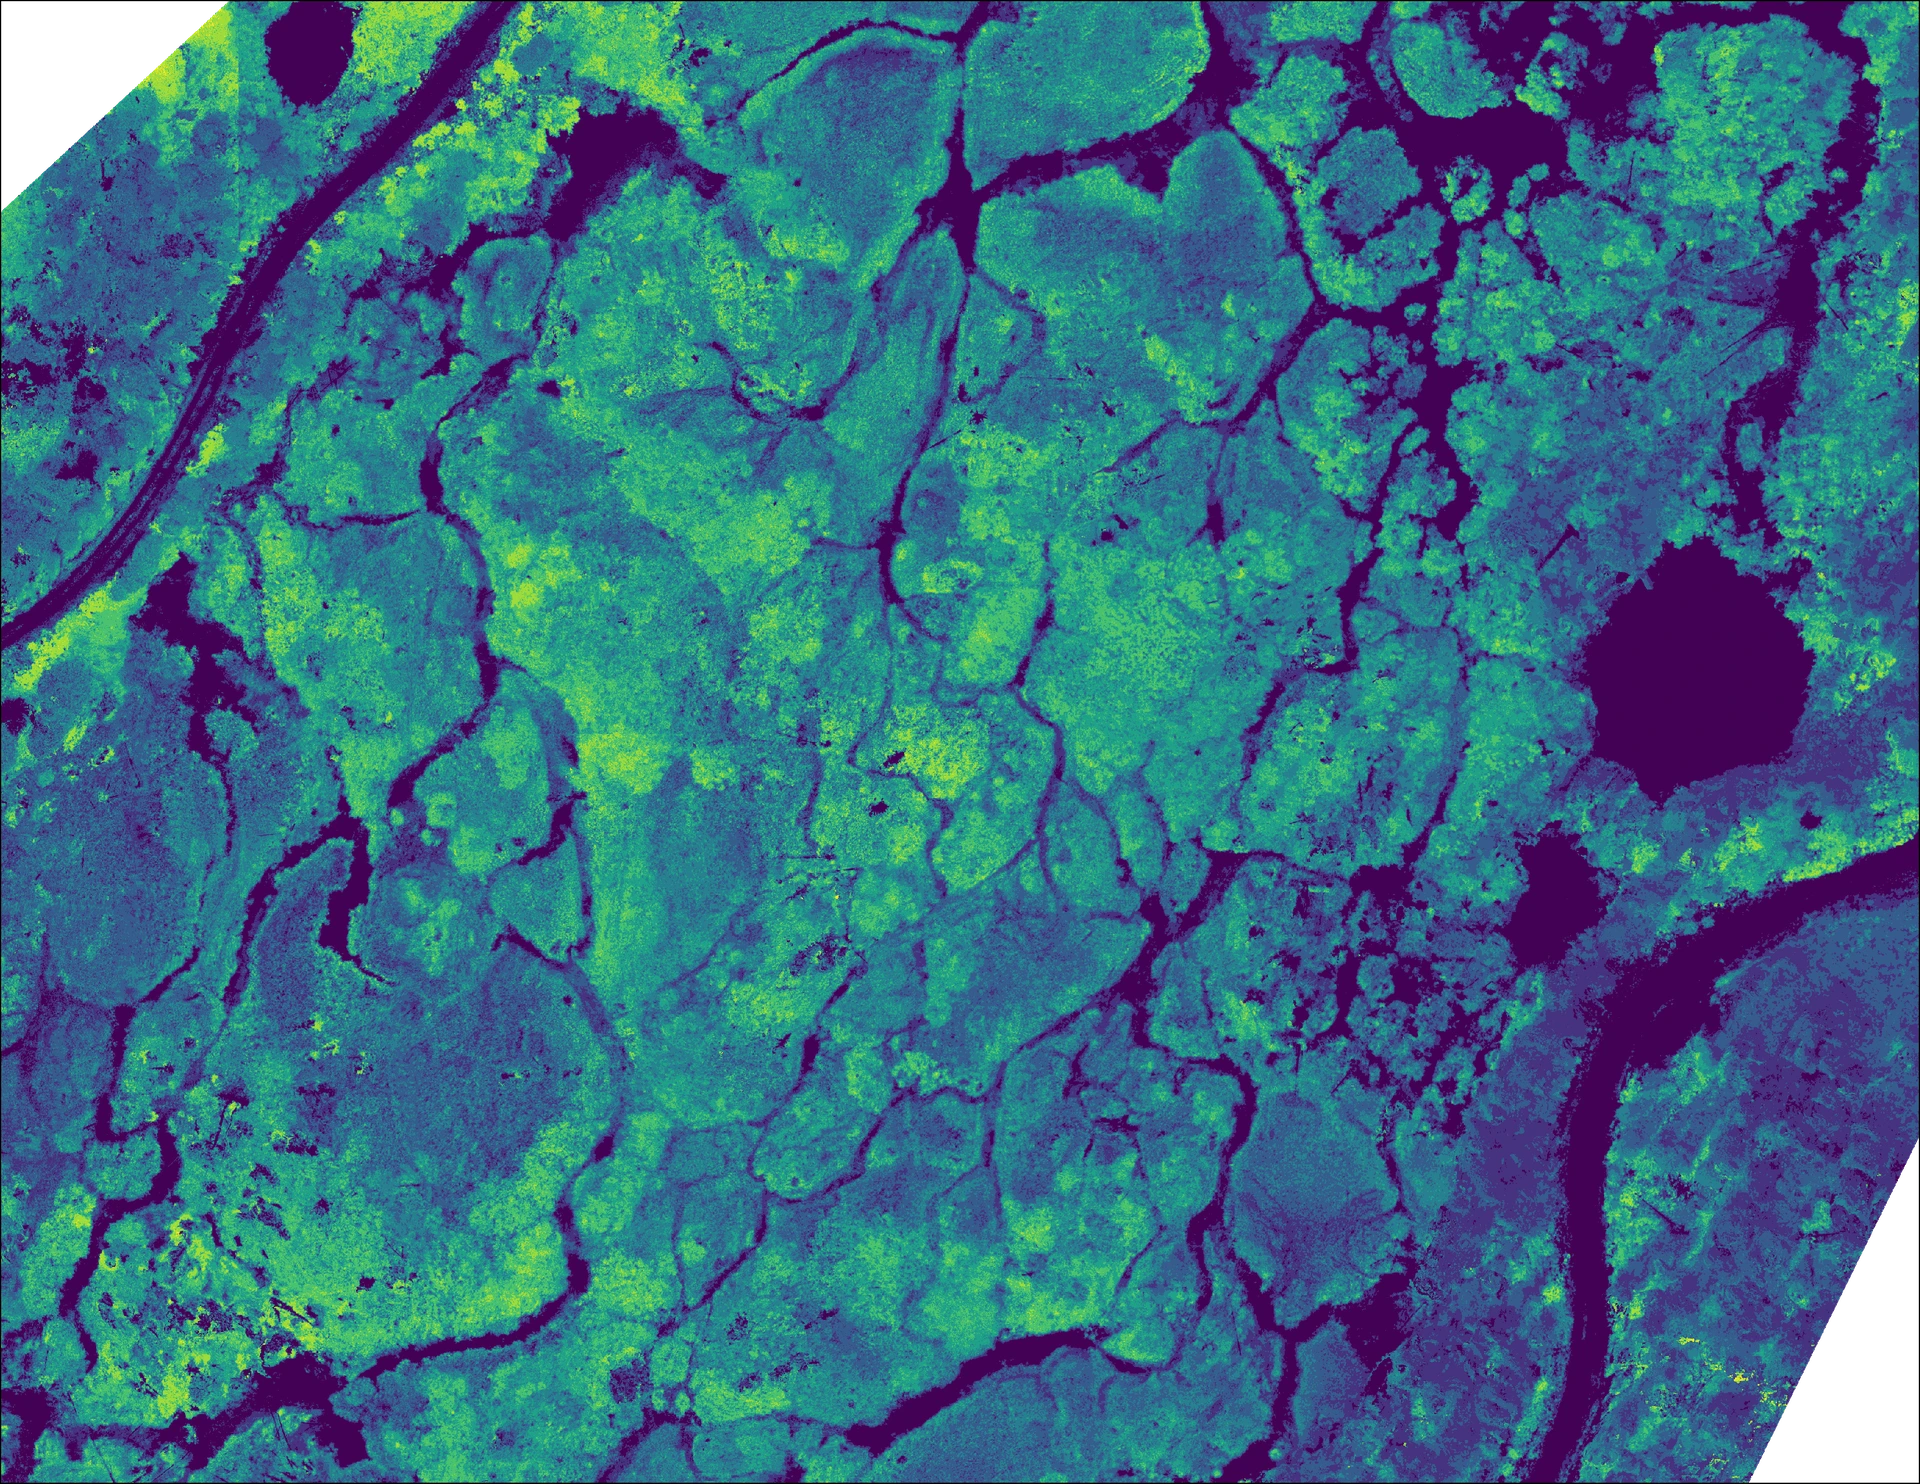
Multispectral imagery can provide us with information beyond what the human eye can see. Thanks to our multispectral remote sensing payload we are able to create spectral indices or combinations of bands that deliver insight into various aspects of plant health, soil moisture levels, watershed boundaries, and land cover classification. Some examples of these products include orthorectified mosaics, digital surface models (DSM), and normalized difference vegetation index (NDVI) rasters.
What knowledge can we create?
By analyzing high-resolution aerial imagery we can extract the information needed to create knowledge. Some of Above Sensing Ltd.’s products may include hydrological modeling, land cover, wetland classification, and environmental impact assessment.